THE F&B DIRECTOR'S REALITY
YOU DISCOVER THE
FOOD COST PROBLEM
ON THE 15TH.
Your best-selling dish has the worst margin and you find out building Sunday's product-mix sheet. Beverage COGS spiked three weeks ago, Finance tells you on the 15th. Tuesday dinner ran over on labour, nobody caught it until payroll closed.
You open Blent Monday morning. The AI flagged that your top-selling pasta has a 19% food cost, your best margin item. It recommends pushing it this week. Beverage COGS spiked Wednesday, Blent alerted you Thursday, not the 15th. Tuesday dinner was overstaffed by 2 FTEs, the AI estimated €1'200/month in savings if you adjust the schedule. Revenue up. Costs under control. Every week.
PRODUCTIVITY & LABOUR COST
YOUR SECOND COST
runs your margin.
you can't see it.
Food cost gets the attention. Labour quietly decides whether the night made money. Blent puts labour hours and cost next to the covers each shift actually served, so overstaffing shows up the same week, not at payroll close.
When HR scheduling and POS covers sit on one screen, productivity stops being a feeling. You see which shifts earned their staff and which ran two people heavy.
vs 30% target
Tue & Wed dinner
if adjusted
not at month-end
THE PRODUCT
EVERYTHING YOUR F&B
TEAM OPENS EVERY MORNING.
Sales & Covers
Revenue per cover, total covers by daypart, outlet, and period, live from your POS. Track what's selling, when, and to whom. No manual export, no weekly rebuild.
→ Revenue per cover: by outlet, daypart, day of week, live→ Menu engineering: margin vs volume per item, star dishes vs drags identified→ Demand forecast: predict covers by daypart to optimise ordering and staffing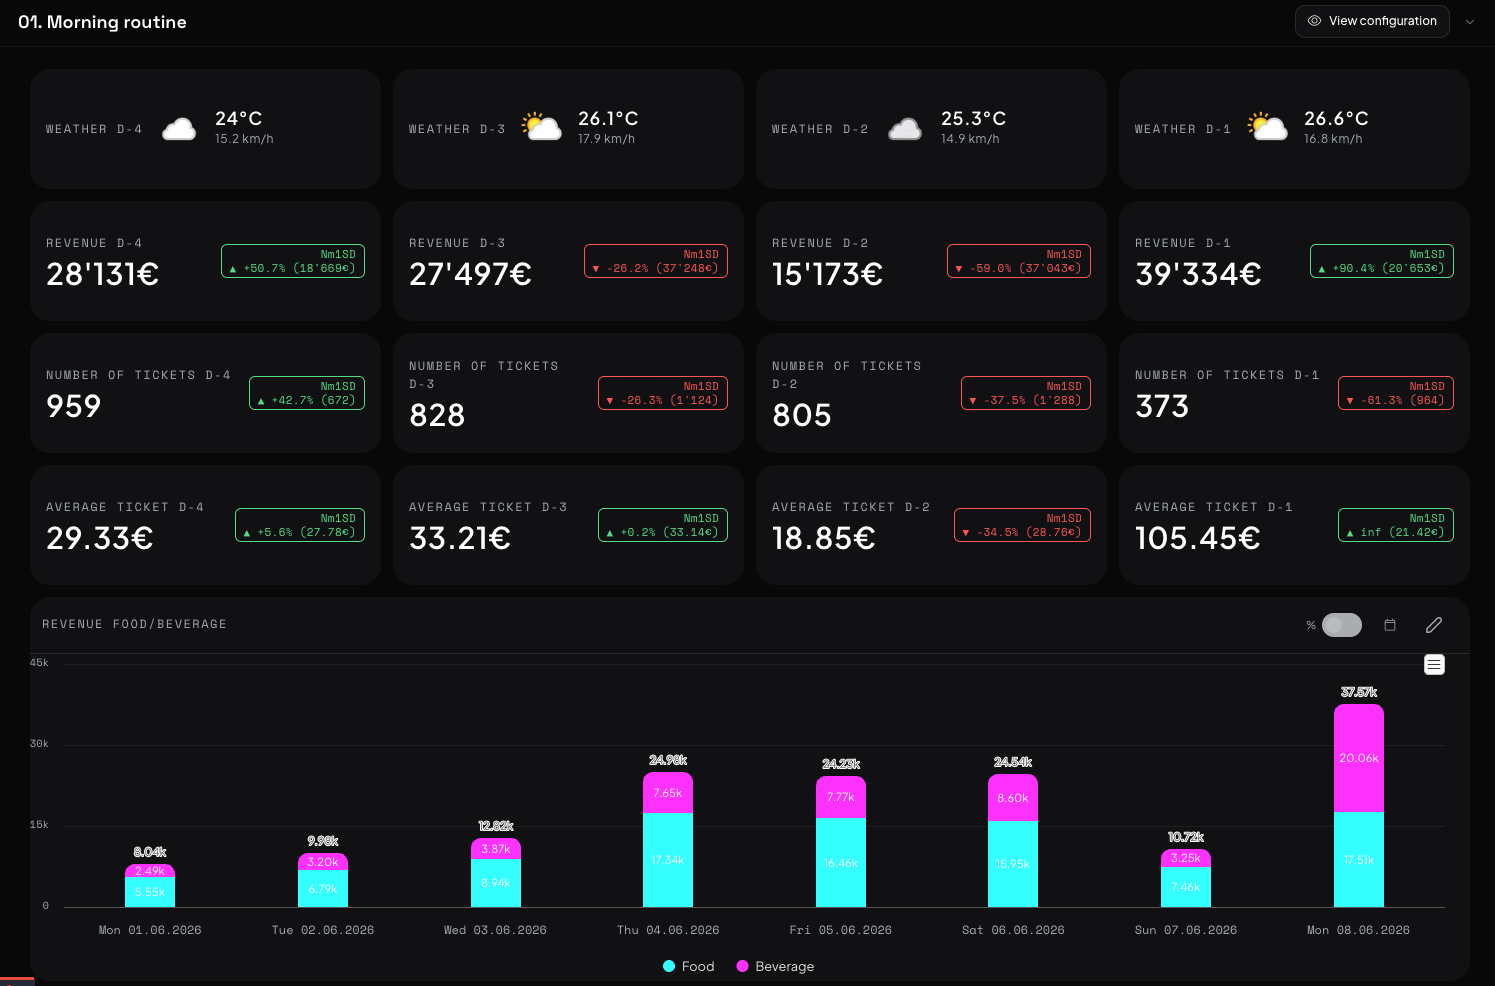
Food & Labour Cost
The two costs that make or break F&B margin, tracked live. Food cost % from POS and inventory. Labour ratio from HR scheduling vs actual covers served. No surprises at month-end.
→ Food cost % live: COGS vs revenue, with mid-month spike alerts→ Labour ratio by shift: hours vs covers served, overstaffing by daypart→ Weekly saving estimate: what each schedule adjustment would save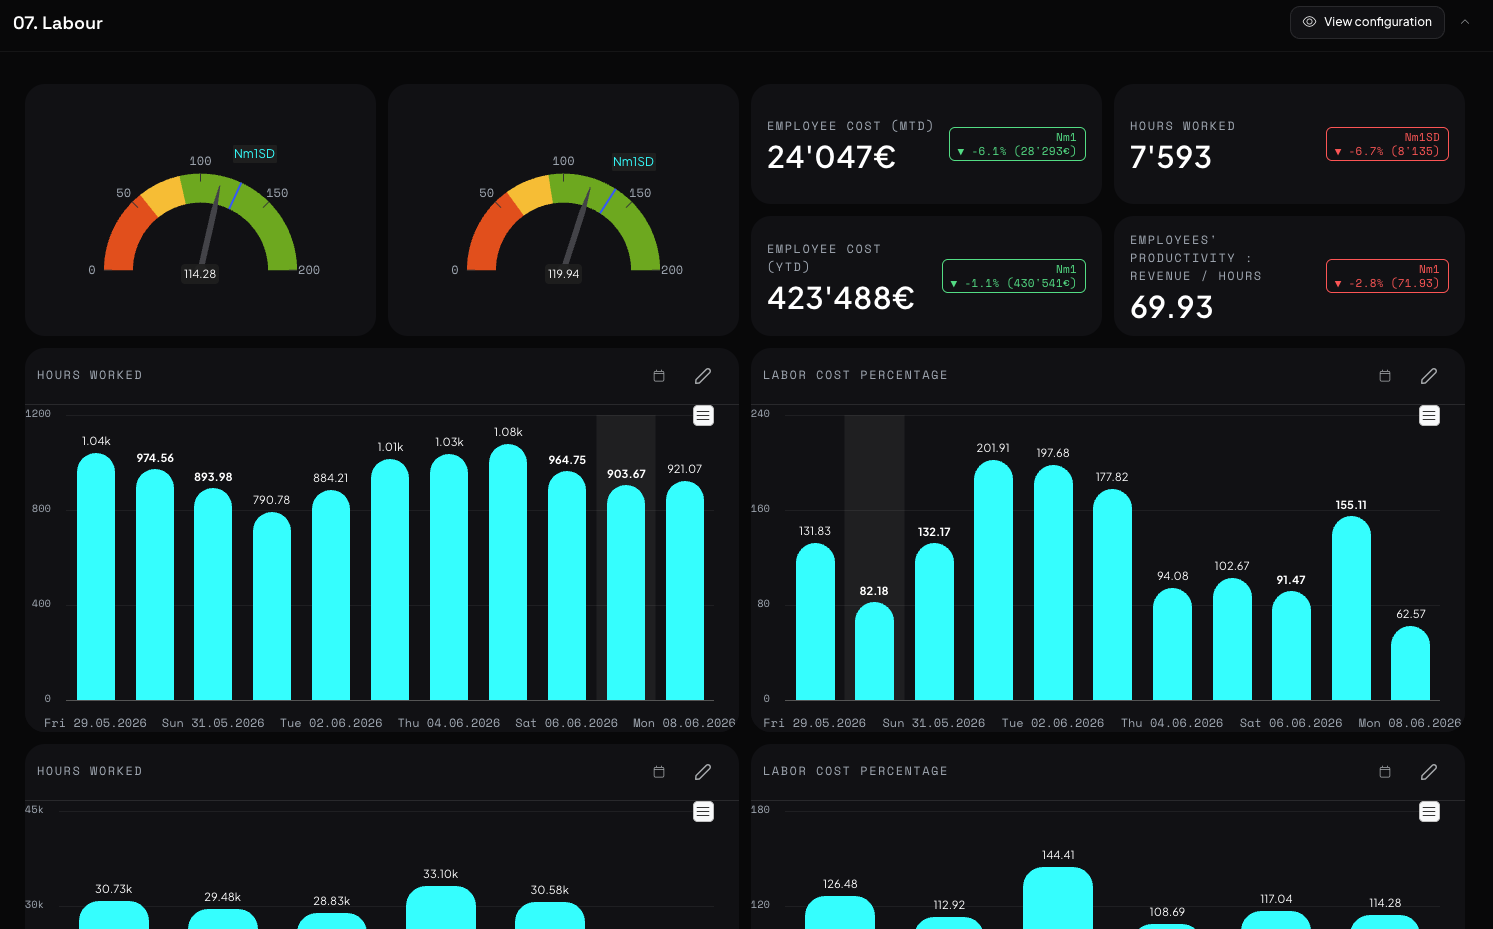
Outlet Benchmark
Compare every outlet on the same metrics, revenue per cover, food cost %, labour ratio, and margin. See who leads, who lags, and exactly what the gap is made of. No spreadsheet needed.
→ Outlet vs outlet on same KPIs: apples-to-apples comparison→ Best-in-class benchmark: identify what your top outlet does differently→ Multi-property: compare outlets across the group and franchise network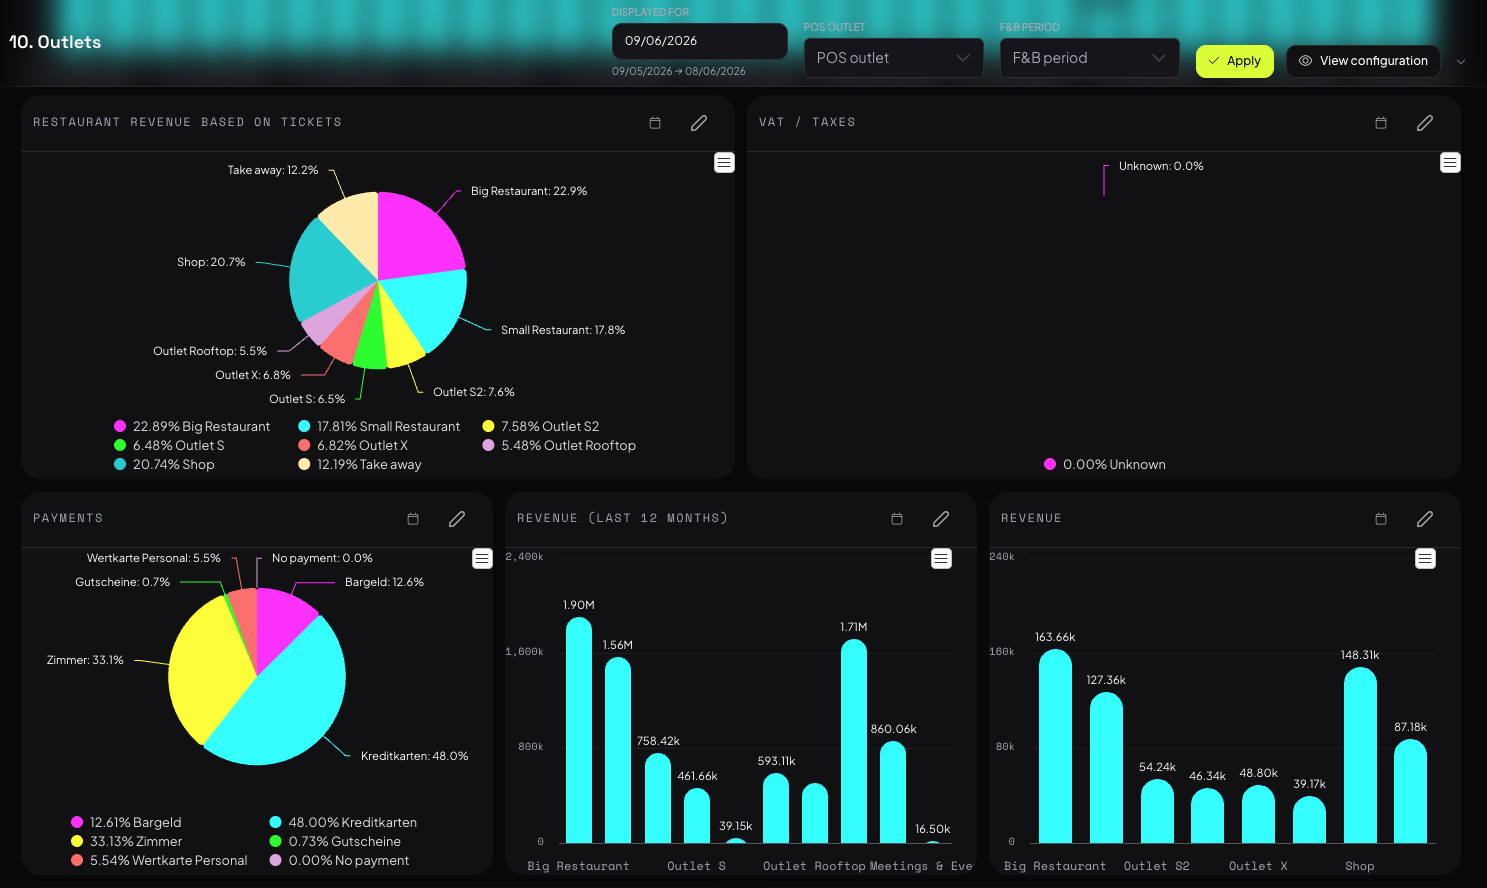
Forecast & Demand
Predict how many covers you'll serve next Thursday, so you order the right quantity of ingredients, schedule the right number of staff, and don't waste either. F&B forecast built from your actual POS patterns, not guesswork.
→ Cover forecast by daypart: breakfast, lunch, dinner, events, next 14 days→ Ordering recommendations: ingredient quantities based on forecast covers→ Staff scheduling input: recommended FTE per shift based on predicted demand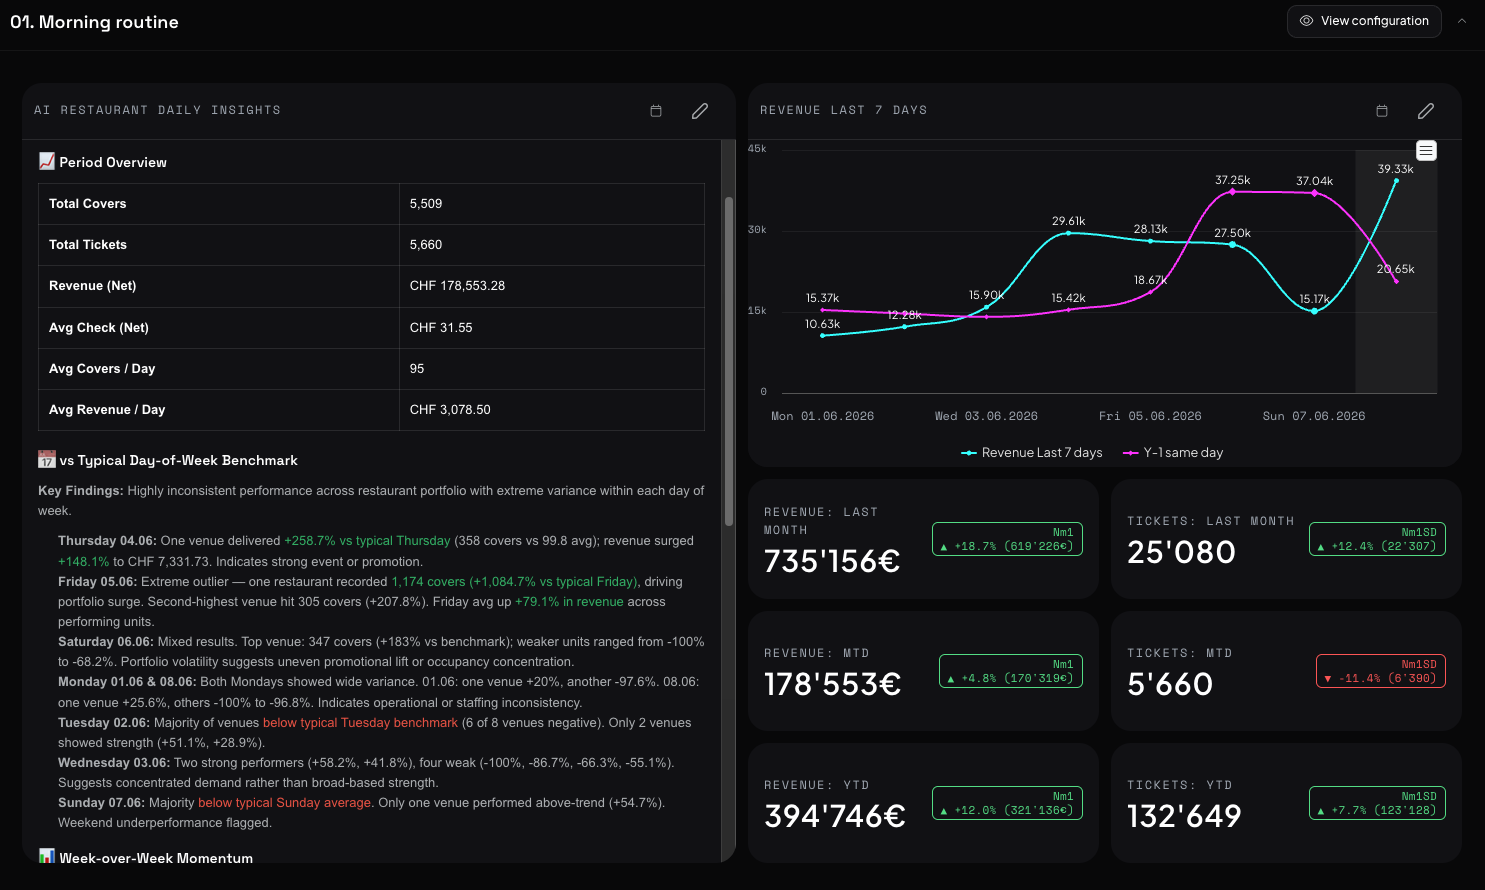
AI RESTAURANT ADVISOR
YOUR DATA IS LIVE.
now it tells you
what to fix.
The AI Restaurant Advisor reads your POS, HR, and inventory data every week and delivers a briefing with specific actions: overstaffed shifts, food cost spikes, outlet underperformance. Numbers attached.
→ Overstaffing detection: identifies which shifts to adjust and estimates saving→ Food cost spike alerts: fires mid-month, not at month-end→ Outlet underperformance: flags which outlet is lagging and why→ Delivered Monday 08:00: your team starts the week with a clear planLabour cost hit 34% this week (target: 30%). Tuesday and Wednesday dinner shifts overstaffed by ~2 FTEs vs actual covers served.
→ Reduce by 2 FTEs Tue/Wed dinner next week. Estimated saving: €1'200/month annualised.
Beverage COGS +18% vs budget this month. Unusual spike, not explained by volume increase.
→ Review supplier pricing or investigate inventory shrinkage. Recommend physical stock count this week.
Dinner revenue per cover at €118, +11% vs LY. Menu engineering working. Le Jardin leading all outlets.
→ No action required. Apply same menu structure to Pool Restaurant where rev/cover is €72.
INTEGRATIONS
your POS.
already connected.
Native F&B integrations: POS, scheduling, inventory, and payroll. All connected, all refreshing continuously. No IT project, no custom development.
THE IMPACT
NUMBERS THAT SHOW
IN YOUR margin.
THE COMPLETE PLATFORM
F&B IS ONE OUTLET.
blent runs the whole hotel.
Covers, food cost, and labour are one room in a bigger house. Connected to the rest of the platform, the GM sees F&B in the context of the whole property, and you get the AI and the open data layer behind it.
Food cost percentage is the ratio of food costs (ingredients purchased or consumed) to food revenue generated. Industry target in hotels is typically 28-32%. Blent connects to your POS and inventory system and tracks food cost % continuously, firing an alert when the ratio crosses your defined threshold, rather than letting you discover the problem at month-end. The alert identifies which category spiked, not just that food cost is high overall.
Labour-to-covers ratio measures labour cost relative to the number of covers served, or labour as a percentage of F&B revenue. It identifies overstaffing or understaffing by shift, outlet, and daypart. Blent connects HR scheduling data with POS covers in real time, showing which shifts are overstaffed, estimating the cost impact, and letting managers adjust next week's schedule before the inefficiency compounds.
Blent's outlet benchmarking compares all F&B outlets: restaurant, bar, room service, events, on the same KPIs: revenue per cover, food cost %, labour ratio, and margin. F&B Directors see immediately which outlet leads, which lags, and what the gap is made of, without building a comparison spreadsheet. The benchmark works across outlets within one property and across properties in a group.
Blent has native integrations with Lightspeed, Micros, Oracle Simphony, Combo, Yokitup, Infrasys and 20+ additional POS systems. For HR and scheduling: 7Shifts, Gastromatic, Planday, TCP, Deputy. For inventory: Marketman, Apicbase, Winnow. All integrations refresh continuously. No custom development required, Blent's team handles the connection.
The AI Advisor reads POS, HR scheduling, and inventory data every week and delivers a structured F&B briefing every Monday morning. It identifies overstaffed shifts with saving estimates, flags food cost spikes by category before month-end, spots outlet underperformance, and surfaces menu mix opportunities, with specific recommended actions and estimated financial impact. No prompts to write, no configuration required beyond connecting your POS and defining your targets.